

Share via


When the answer is in the data, but nobody can see it
Earlier this year, an online retailer we work with saw its declined payments climb sharply over a single week. Their development team spent several days reviewing the checkout and integration, convinced something had broken. When we looked at the data together, the cause was much narrower: the spike was concentrated among customers of one issuing bank, which was experiencing temporary disruptions. Nothing in the merchant’s own stack needed fixing. The answer had been in their payment data all along. It simply wasn’t visible.
Online merchants are not short of payment data. Transaction exports, settlement reports and finance spreadsheets are all within reach. However, when something changes, such as a dip in approvals, a jump in declines or an unexpected swing in revenue, that data rarely explains why on its own.
This gap between having data and understanding it is an important consideration for any business that relies on online payments to grow.
Payment analytics: key takeaways
- A spike in declined payments does not always mean the checkout is broken. It can often be traced to a single issuing bank with a temporary problem.
- A hard decline usually points to a permanent issue, such as invalid card details, so retrying is unlikely to help. A soft decline is usually temporary, so the payment could still succeed on a later attempt.
- Headline numbers can mislead on their own. Good payment analytics reads transactions, revenue and basket value together to show what actually changed.
Why payment data is difficult to interpret
A single payment metric can have many causes. A drop in successful payments could be the result of a processor issue, a particular issuing bank, customer behaviour, fraud controls or another part of the payment flow.
Raw totals rarely show which of these is responsible. As a result, teams often fill the gap with manual exports, pivot tables and assumptions, which takes time and frequently leads different people to different conclusions.
When every team works from a different set of numbers
In many businesses, finance, ecommerce and operations each report on payment performance in their own way. Each team pulls data differently, applies different filters and defines metrics like payment volume or approval rate slightly differently.
The outcome is familiar: conversations that should focus on decisions turn into debates about whose figures are correct. It’s important to note that this is rarely a skills problem. It is a consistency problem, and it can only be solved by giving every team the same definitions and the same source of truth.
Why a decline rate on its own isn’t enough
A decline rate tells a business that payments are failing, but not why, or what can be done about it.
The distinction that matters most is between hard and soft declines. A hard decline usually points to a permanent issue, such as invalid card details or a blocked card, and retrying the payment is unlikely to help. A soft decline is usually temporary, caused by insufficient funds, an issuing or acquiring bank outage, or another technical issue, which means the payment could still succeed on a later attempt.
Without this split, every failed payment looks the same. With it, merchants can see which declines represent lost sales and which represent revenue that may still be recovered.
Not every spike in declines is a system failure
When declines rise suddenly, the natural response is to assume something is broken. Developers are pulled in, the checkout is reviewed, and time is spent investigating a problem that may sit outside the business entirely.
In practice, a spike in declines does not always mean the whole tech stack has a problem. It can often be traced to a single issuing bank experiencing difficulties. Being able to view declines by bank, and across short and longer time periods, allows teams to separate a temporary disruption from a genuine trend, and to focus their effort accordingly.
Why revenue trends need context
An increase or decrease in revenue is only useful once a business understands what caused it. A campaign, a seasonal peak, larger baskets or a shift in how customers pay can all produce similar headline numbers, but each calls for a different response.
Reading metrics together often reveals what a single number hides. For example, a month in which total transactions fall while gross merchandise value (GMV) rises indicates that customers placed fewer orders but spent more on each one. Seen in isolation, either figure could have been cause for concern.
Basket value offers a similar lesson. In one merchant example, the median basket stayed fairly consistent at around R243 to R256 week on week, while the average sat much higher at roughly R450 to R490. This suggests that a small number of high-value purchases were pulling the average up, and that the typical customer transaction is closer to the median.
Payment choice also shapes spend. In the same example, customers using buy now, pay later (BNPL) options spent more per transaction, suggesting that flexible payment methods may help shoppers feel more comfortable with higher-value purchases. For a business deciding which payment methods to prioritise at checkout, that is a meaningful signal.
Moving from payment reporting to payment understanding
For a long time, payment reporting has answered one question: what happened? That was sufficient when payments were treated as a back-office function. Today, checkout is one of the most important levers an online business has, and every failed payment represents a customer who intended to buy.
None of this requires a business to hire a team of data analysts. It does mean treating payment data as a source of decisions rather than a record of history, with consistent definitions, visibility into the causes behind the numbers, and enough context over time to separate normal patterns from meaningful change.
How Peach Payments Analytics helps merchants turn payment data into answers
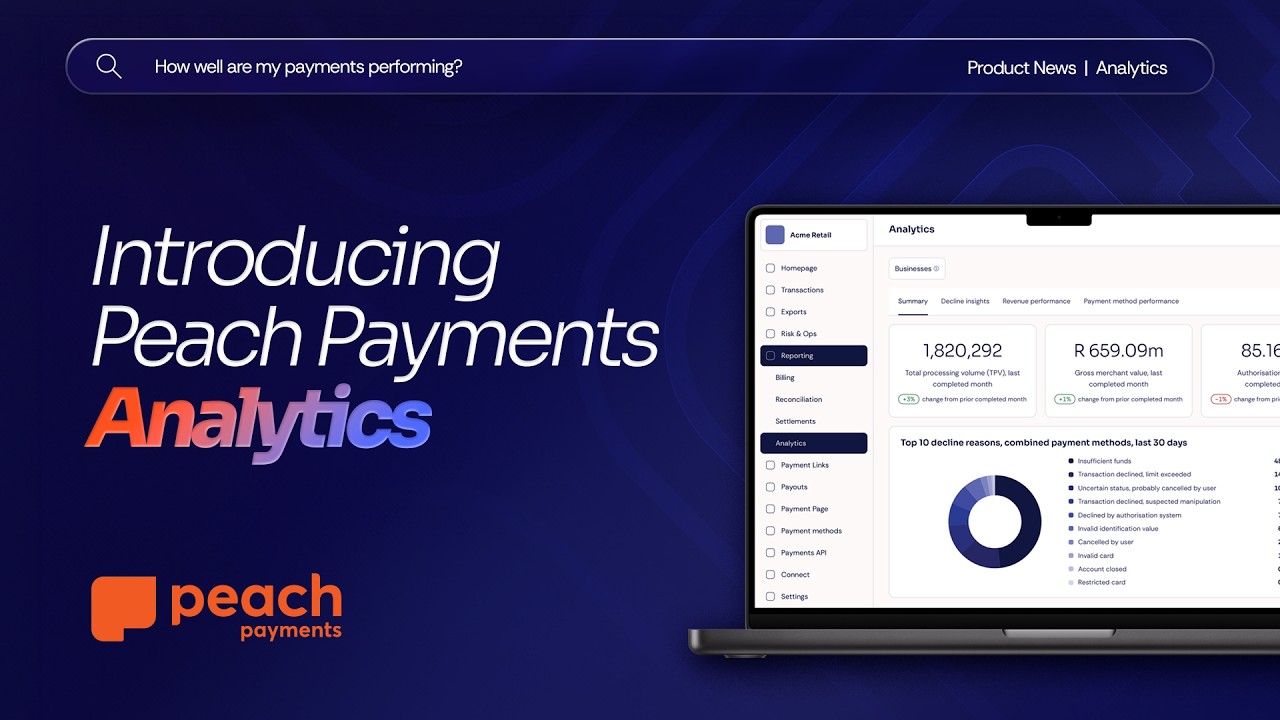
Peach Payments Analytics is a payment performance dashboard built into the Peach Payments Dashboard, available free of charge to all Peach Payments merchants, in every region we operate. It brings payment performance, decline and revenue insights into one view, using the same definitions and calculations for everyone in the business.
The dashboard is organised into four areas. The Summary view gives a quick health check of processing volume, GMV, authorisation rates, top decline reasons and payment method mix. Decline Insights shows decline trends over 7 days, 60 days and 12 months, separates hard and soft declines, and breaks failures down by issuing bank, bank identification number (BIN) and payment method. Sales Performance compares GMV across the last three years and tracks basket values and the strongest trading days. Payment Method Performance shows which payment methods have the best authorisation rates, and which need attention.
For merchants, the result is less time spent reconciling numbers and more time spent acting on them: understanding where performance is changing, what may be driving it, and where there is an opportunity to improve conversion or recover revenue. To get started, log in to the Peach Dashboard and select Analytics under Reporting, or contact sales@peachpayments.com for a walkthrough.
Visit the Peach Payments Analytics page for more info.
Scale with Peach
Learn how we help scale some of Africa's most exciting businesses
Business tips, case studies, interviews with online store owners and business trends…

South Africa’s online retail opportunity hides in the trust gap

Why good marketing ideas get stuck in the development queue
Without payment analytics, payment data doesn't tell the full story of business performance

2026 Online Retail Report just launched. Here's what you need to know

Meet Tegan: Turning Risk into a Growth Enabler

Empowering Change: Reshaping Payments

Meet Akshay: Solving complexity on the front line

‘Prove you're human’ is the wrong security question in agentic commerce

Solving complexity: Part 2 - The Strategic Pivot
Solving complexity: Part 1 - The Irony of Progress

Retail & E-Commerce payments—The Conversion Engine

Travel & Hospitality Payments - Fly me to the boom

Five payment pain points hotels face and how to solve them

Giving your customers the ultimate checkout shortcut with Embedded Express

PayJustNow on Peach Payments’ POS device improves in-store payment experience
Peach Payments brings Apple Pay to merchants

From Check-in to Check-out

How Multiple Payment Options Improve Online Travel Sales
The New Standard for Payouts in South Africa
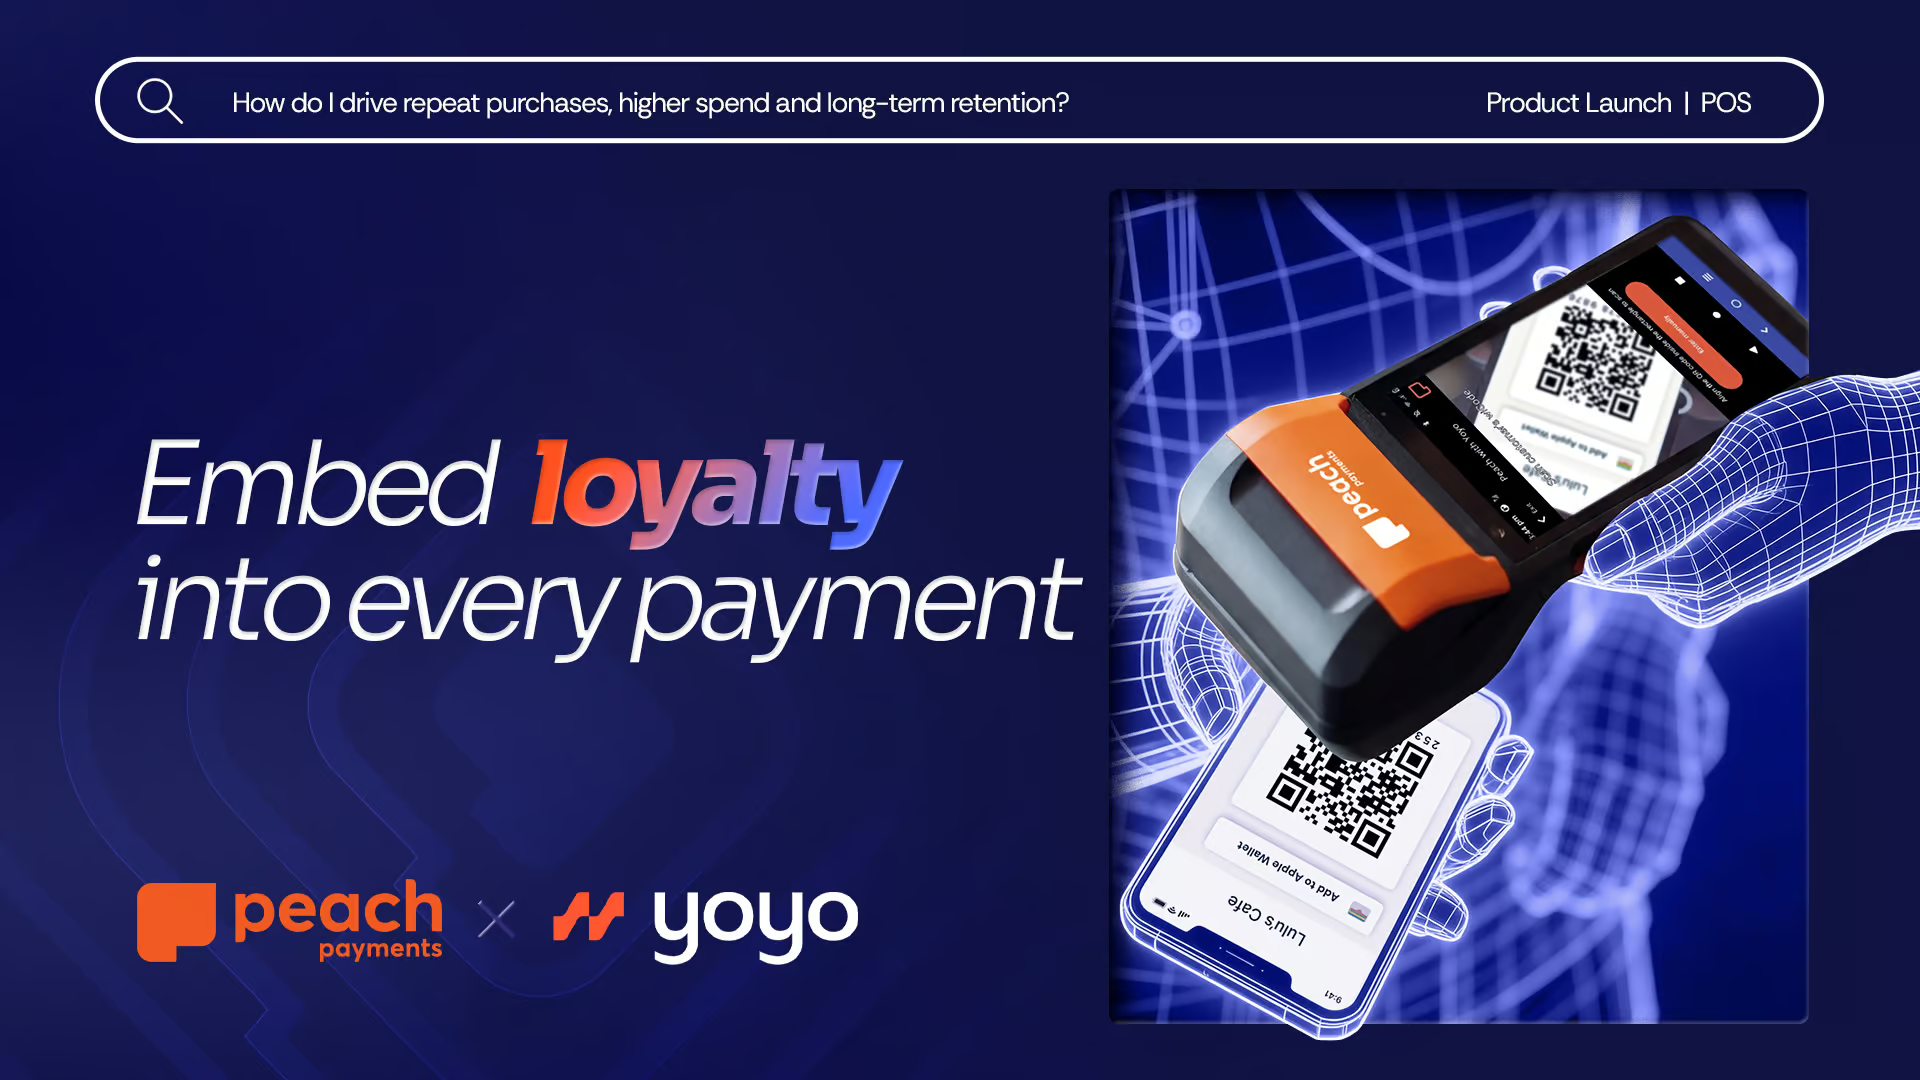
Peach Payments and Yoyo add bank card-linked loyalty to Digit Pro POS device
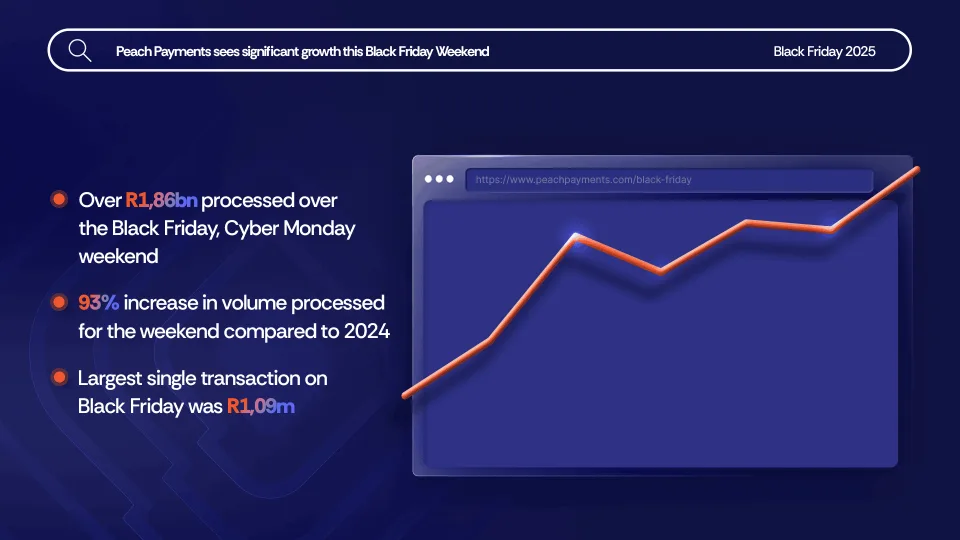
Black Friday up 93% over 2024, R1,86bn processed

Bringing Our New Peach Values to Life

Samsonite in-store payment methods
How global and regional companies can use the Mauritius IFC to centralise online payments and treasury functions

# PeachFriday Merchant Deals 2025
A merchant’s guide to chargebacks

Four Black Friday payment realities for merchants
What are Direct Merchant Accounts (ISO) versus Aggregation Accounts?

What Is 3RI? Everthing you need to know about Requestor-Initiated Authentication

Highlights from the 2025 World Wide Worx Online Retail Report
What is Interchange? Everything you need to know about interchange fees